Why Is the Server Down? 5 Causes That Have Nothing to Do with Hardware
Server downtime is rarely a hardware failure. Learn the 5 most common causes — from a full disk to expired credentials — and how to prevent each one.
Quick answer
What to know before reading further
- Server downtime is rarely a hardware failure. The most common causes are software crashes or failed updates, network misconfiguration, a full disk, expired credentials, or an unresponsive external dependency.
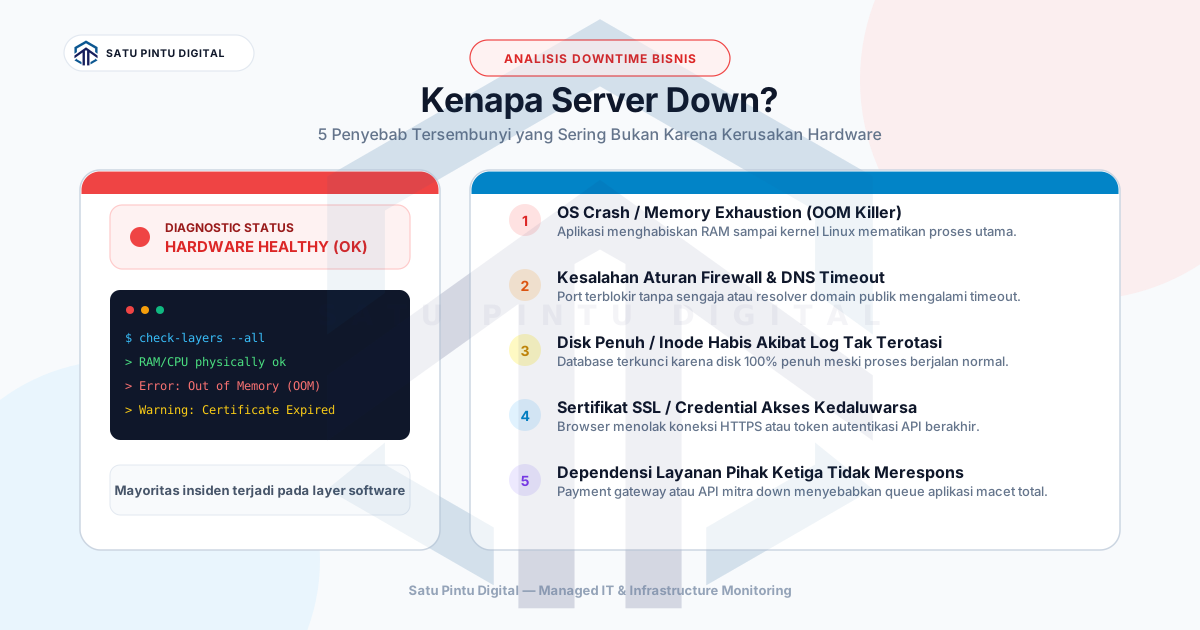
When a server suddenly becomes unreachable, the default assumption is: “The hardware must have failed.” It is a reasonable instinct — but it is usually wrong. In the day-to-day practice of infrastructure management, hardware failure is actually one of the least common causes of downtime, not the most frequent.
The causes that show up most often are far less dramatic: a log file that was never rotated, an SSL certificate that quietly expired, or a routing configuration that changed after an update.
Here are five causes of server downtime that have nothing to do with hardware — and how to prevent each one.
1. OS or Software Crash
What Happens
Operating systems are not unconditionally stable. The Linux kernel can experience a kernel panic — a state where the kernel detects a fatal error and cannot continue. Windows Server can hit a Blue Screen of Death (BSOD). And even without an OS crash, the Linux OOM (Out of Memory) killer can terminate critical processes automatically when the system runs low on RAM.
Failed updates also fall into this category. An OS patch applied without prior testing — or a software dependency that changed after an update — can leave services unable to restart.
How to Prevent It
- Apply patches to a staging environment before production
- Use monitoring that tracks the status of critical services (not just whether the server responds to a ping)
- Set memory alerting before the OOM killer activates — for example, alert when RAM usage exceeds 85%
- Enable crash dumps or kdump so there is forensic evidence when a kernel panic occurs
2. Network Misconfiguration
What Happens
The physical server may be perfectly fine — powered on, processes running — but unreachable from the outside because something is wrong at the network layer. Common scenarios:
- Firewall rules that became too restrictive after a configuration change, blocking traffic that should be allowed
- A routing table that was corrupted after maintenance or a network device update
- DNS timeout — a domain cannot be resolved to the correct IP, even though the IP itself is reachable
- BGP or ISP uplink issues on the provider’s side
What makes this dangerous: from the user’s perspective, the effect is identical to the server being down. But from the server’s side, nothing is wrong. Without proper network monitoring, teams waste time looking for the problem in the wrong place.
How to Prevent It
- Monitor from an external location (outside the server’s network) — not just from within
- Use tools like Blackbox Exporter (Prometheus) or external uptime monitoring services
- Document every firewall and routing change in a change log
- Verify connectivity to the server after every maintenance window before declaring it complete
3. Full Disk or Exhausted Inodes
What Happens
This is the most preventable cause of downtime — and it still happens regularly. When a disk fills up, many things can break:
- A database cannot write new transactions → errors or crash
- A web server cannot write access logs → the service stops
- An application cannot create temporary files → request processing fails
But there is a less obvious scenario: inode exhaustion. Inodes are metadata structures in Linux filesystems that store file information. A disk can still have gigabytes of free space, but if inodes are exhausted — because of too many small files, for example from PHP sessions or temporary files — no new files can be created. The result is the same: services crash.
The most common root cause of full disks is log files that are never rotated, or backups stored locally without any retention limit.
How to Prevent It
- Set alerting thresholds at 75% and 90% — do not wait until 100%
- Configure logrotate for every application that generates logs
- Monitor inode usage separately from disk usage (
df -i) - Never store backups on the same disk as production data
4. Expired Credentials or Access Tokens
What Happens
Many modern systems depend on time-limited credentials: SSL/TLS certificates, API keys, service account tokens, or database passwords rotated on a schedule. When any one of these expires without anyone noticing, services that depend on them stop immediately.
The most common scenarios:
- SSL certificate expired — browsers immediately reject connections, HTTPS applications become inaccessible
- Third-party API keys deactivated or expired because they were not renewed
- Database credentials changed after a security rotation but not updated in the application configuration
What makes this insidious: the server is healthy, the application is running, but a piece of functionality breaks because one credential fails.
How to Prevent It
- Use monitoring that automatically checks SSL certificate expiry dates — alert 30 and 7 days before expiry
- Maintain an inventory of all API keys and service credentials with their expiry dates in a central location
- When rotating credentials, ensure there is a checklist of every system using those credentials
- Consider implementing a secrets manager (HashiCorp Vault, AWS Secrets Manager) to centralize credential lifecycle management
5. Unresponsive External Dependencies
What Happens
Modern applications rarely run in isolation. They depend on:
- A database running on a separate server
- A message queue (RabbitMQ, Kafka) as middleware
- Third-party APIs (payment gateways, SMS gateways, authentication services)
- Other microservices within the same architecture
When any of these dependencies stops responding — because it is down, timing out, or has changed its API — the applications depending on it can crash or become non-functional. From the user’s perspective, the website or service “is down,” even though the main server is still running.
This frequently manifests as cascading failure: one component fails, causing request queues to back up, which overloads other components until they fail too.
How to Prevent It
- Implement health check endpoints in every service that include the status of its dependencies
- Use a circuit breaker pattern — if a dependency fails, the application should degrade gracefully (show an informative error, not crash completely)
- Monitor the latency and error rate to every external dependency, not just its uptime
- Periodically test dependency-down scenarios — small-scale chaos engineering
Logging and Audit Trails: The Asset That Is Consistently Undervalued
Every cause above is easier to diagnose when logging is solid. Without logs, the team guesses. With structured logs, investigation starts from real data.
Key practices:
- Centralize logs — do not leave logs only on the server that is having problems (if the server is down, the logs are inaccessible too)
- Retention policy — store logs long enough for incident investigation and historical audit purposes
- Structured logging — logs in a queryable format (JSON is better than plain text at any real volume)
- Audit trail for configuration changes — who changed what, and when
For more on building effective observability, read our article on infrastructure monitoring basics, and what is a managed server if you are considering handing off infrastructure operations to a service provider.
For industry-standard references on reliability and incident response, Google’s SRE Book is freely available online and covers the practices that underpin most professional infrastructure operations. For NGINX-specific production practices, NGINX’s production tips guide is a useful operational checklist.
Runbooks: So Response Does Not Depend on One Person’s Memory
The final step that is consistently skipped: document the response steps for each type of incident in a runbook. A runbook does not need to be a long formal document — a concise checklist of the first actions to take when a specific type of problem appears is enough.
Without a runbook, incident response depends on one person’s memory. When that person is on leave or unavailable, everything slows down. With a runbook, whoever is on call starts from a structured process.
Your servers need proactive monitoring and a team ready to respond before downtime hits? Satu Pintu Digital provides Managed Server and infrastructure monitoring with 24/7 alerting, structured incident handling, and monthly reports that business owners can actually understand.
Read the sources
References and documentation
Frequently asked
Questions teams ask before implementation
- How long does it typically take to diagnose a server outage?
- Without monitoring and structured logging, diagnosis can take one to four hours or more, because the team must rule out possibilities one by one. With proactive monitoring and structured logs in place, most root causes can be identified within 15 to 30 minutes. That is why investing in observability is not a luxury — it is operational efficiency.
- What is the OOM killer and why can it cause server downtime?
- OOM (Out of Memory) killer is a Linux kernel mechanism that automatically terminates processes when the system runs out of memory. If the process killed is a critical application — a database or web server — that service stops immediately. OOM killer is not a crash; it is a kernel protection mechanism. But the effect from the user's perspective is the same: the service becomes unreachable.
- How do you make sure SSL certificates don't expire unexpectedly?
- The most reliable approach is automated monitoring that checks certificate expiry dates regularly and sends alerts 30, 14, and 7 days before expiry. Tools like Uptime Kuma, Nagios, or commercial monitoring services have this built in. Do not rely on manual calendar reminders — they are too easy to miss.
- What is the difference between server down and application down?
- Server down means the machine or OS itself is unreachable — SSH connections fail, all services on that machine stop. Application down means the server is still running, but a specific application process has crashed or stopped responding. Both look the same to end users, but the approach is different: server down is an infrastructure problem, application down is a software layer problem.
This article is part of Satu Pintu Digital's field notes. The next article covers a related topic.
Keep reading